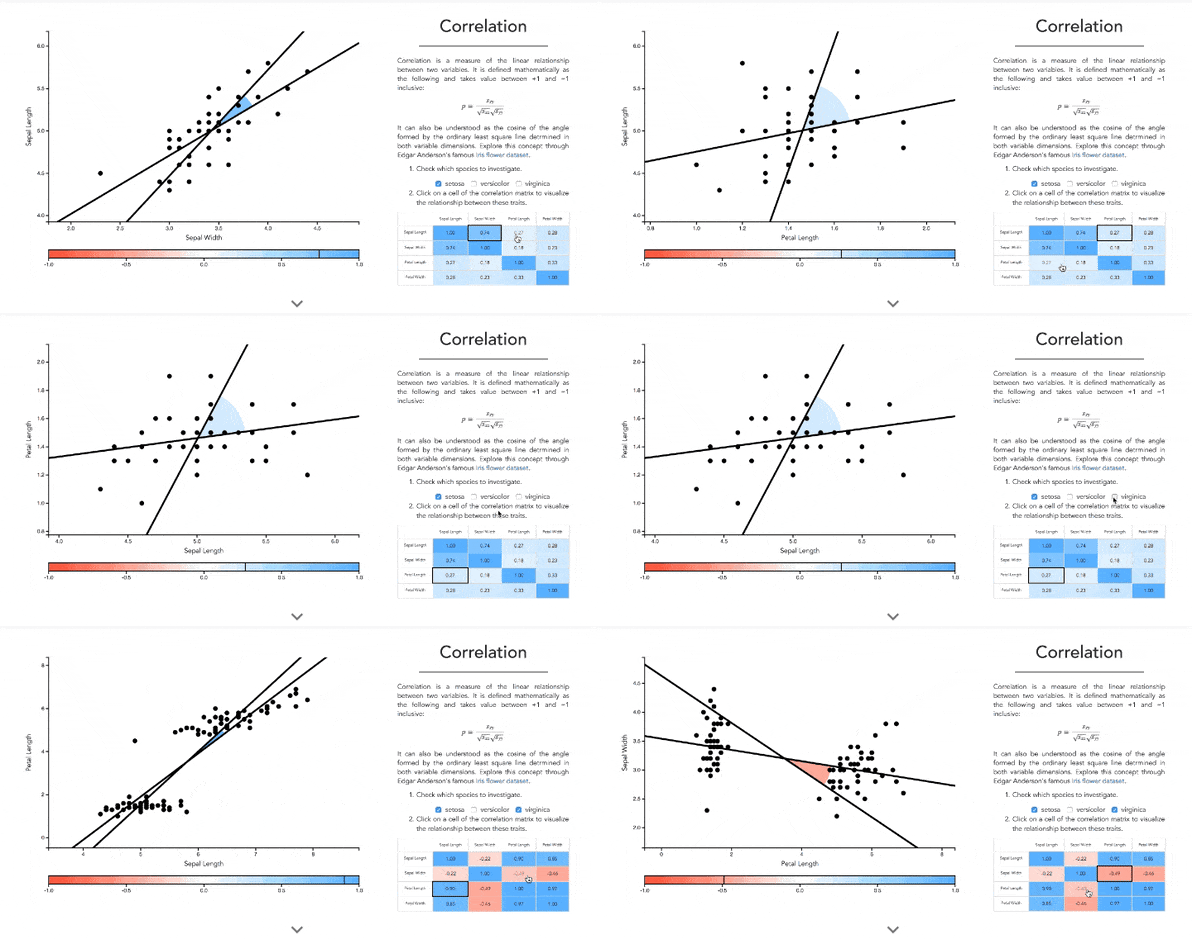
In my search for articles that help put Statistics into context, I came across Scatter blog and this data visualization from a student at Brown (related FastCo article) I think you guys will appreciate!
Is it time to break up Google? (OpEd from NYTs)
Uber's CEO Plays With Fire (NYTs)
The Everlane of wine?! (Quartz)

The data visualization is great! Thanks Kaitlin!
ReplyDelete